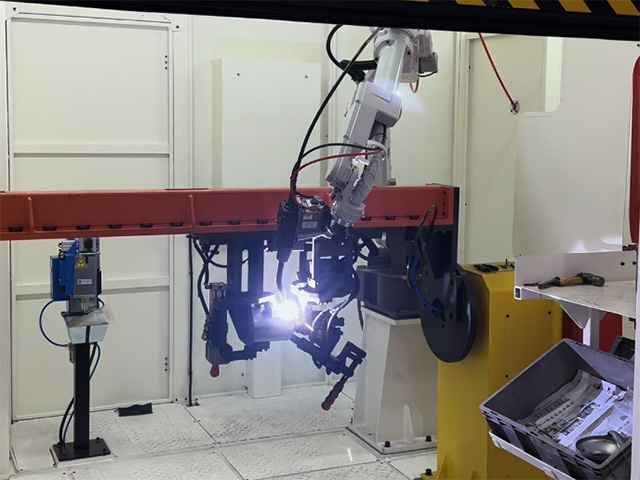
What Does Robotic Welding ROI Measure?
Robotic welding ROI measures whether the cash benefits created by an automated cell justify its total investment and operating risk. The analysis should compare the future automated process with a clearly defined current-state baseline.
Benefits can come from higher output, lower direct labor per good part, improved first-pass yield, reduced rework, more consistent weld deposition, lower injury exposure, and improved delivery performance. Costs include more than the robot. They include engineering, fixtures, positioners, welding equipment, sensing, guarding, installation, training, qualification, maintenance spares, and production ramp-up.
A model becomes misleading when it counts every operator as immediate cash savings, assumes 100% uptime, or uses robot welding speed as the complete cycle time.
Start with Takt Time and Required Capacity
Takt time is the available production time divided by customer demand, and it establishes the maximum average time allowed per good unit. The automation concept must meet takt at the expected mix and operating pattern.
The basic equation is:
Takt time = Net available production time / Required good units
Net available time excludes planned breaks, preventive maintenance, meetings, and other known losses. Required good units should include expected scrap and service demand where appropriate.
If demand is 300 good assemblies in 900 net production minutes, takt time is 3 minutes per good assembly. A cell with a nominal 2.5-minute cycle may still miss demand if changeovers, faults, cleaning, and quality losses reduce availability.
What Must Be Included in Robotic Welding Cycle Time?
Full cycle time includes every repeated event required to release a completed part, not only arc-on time. A useful time study separates value-adding and supporting activities.
|
Cycle Element |
Examples |
|
Loading |
Part pickup, orientation, presence checks, clamp close |
|
Positioning |
Robot approach, positioner indexing, settling |
|
Welding |
Arc-on travel, starts, stops, crater fill, weaving |
|
Sensing |
Touch searches, laser scans, seam tracking setup |
|
Service |
Nozzle cleaning, wire cutting, anti-spatter application |
|
Unloading |
Clamp open, cooling delay, part removal |
|
Quality |
Vision check, gauge, marking, data recording |
|
Control |
PLC handshakes, recipe confirmation, safety reset |
Arc-on percentage is useful for improvement, but a high percentage is not the only goal. Parallel loading on a two-station positioner may create more capacity than a small increase in travel speed.
How Should OEE Be Used?
Overall equipment effectiveness converts ideal production potential into actual good output by combining availability, performance, and quality. It is calculated as:
OEE = Availability × Performance × Quality
Availability captures unplanned downtime against planned production time.
Performance captures speed loss, minor stops, and cycles slower than ideal.
Quality captures good parts as a share of total parts produced.
Do not insert a generic OEE target without evidence. A new cell may ramp from low availability to a stable level as operators learn, spare parts are stocked, and programs mature. Build monthly ramp assumptions into the first-year cash flow.
OEE also prevents double counting. If quality loss is already included in OEE, do not subtract the same scrap again unless the model clearly separates output capacity from scrap cost.
How Is Labor Benefit Calculated Correctly?
Labor benefit should reflect work that is actually removed, redeployed, or avoided—not simply the number of people standing near the current process. Automation often changes tasks rather than eliminating all labor.
The future cell may still require:
Loading and unloading.
Part preparation and tack welding.
Program selection and first-off approval.
Consumable replacement.
Inspection and rework.
Preventive maintenance.
Material movement.
Calculate current and future labor hours per good part, then apply the organization’s loaded labor cost. If employees are redeployed to constrained operations, quantify the added throughput or avoided hiring. If no cash or capacity effect occurs, label it as productivity improvement rather than guaranteed payroll savings.
Which Quality Benefits Belong in the Model?
Quality benefits should be based on measurable changes in scrap, repair hours, inspection effort, and customer risk. Robotic welding can improve repeatability, but only when incoming parts, fixtures, procedures, consumables, and maintenance remain controlled.
Potential benefits include lower repair time, less over-welding, stable wire consumption, reduced destructive testing frequency where permitted by the quality plan, and fewer downstream dimensional corrections. Use historical defect Pareto data to identify which failures automation can realistically address.
For example, a robot may reduce variation in travel speed but will not automatically fix oversized gaps or contaminated material. Benefits attributed to those problems require fixture, preparation, or sensing changes in the project scope.
What Is the Total Installed Cost?
Total installed cost is the amount required to reach stable, approved production—not the quoted price of the robot arm. A complete capital estimate may include:
Robot, controller, welding package, and dress equipment.
Positioners, tracks, gantries, or additional axes.
Fixtures and quick-change tooling.
Seam sensing, vision, process monitoring, and traceability.
Fencing, doors, scanners, extraction, and safety validation.
PLC, HMI, networking, and plant-data integration.
Freight, installation, utilities, and foundation work.
Programming, trials, welding-procedure qualification, and acceptance testing.
Training, documentation, recommended spares, and ramp-up support.
Lost production or temporary capacity during installation.
A contingency should reflect project maturity. A repeated standard cell needs less uncertainty allowance than a first-of-kind line with new parts and processes.
How Is Payback Calculated?
Simple payback equals net initial investment divided by annual net cash benefit. It is easy to communicate but does not account for cash-flow timing after the payback point.
Simple payback = Net investment / Annual net cash benefit
Net investment may subtract grants, tax incentives, or resale value where those amounts are confirmed. Annual net benefit equals recurring labor, capacity, quality, and consumable benefits minus maintenance, software, utilities, and other incremental costs.
For larger investments, also calculate net present value and internal rate of return using the company’s approved discount rate and project life. Include replacement items such as torches, sensors, batteries, and major service events in the relevant years.
How Should Sensitivity Analysis Be Structured?
Sensitivity analysis shows whether the project remains attractive when important assumptions are wrong. At minimum, test production volume, uptime, cycle time, first-pass yield, and labor realization.
A practical three-case model uses:
|
Case |
Volume |
Ramp and Uptime |
Benefit Assumption |
|
Conservative |
Below forecast |
Slower ramp, more downtime |
Partial labor and quality benefit |
|
Base |
Approved forecast |
Expected learning curve |
Most likely benefit |
|
Upside |
Higher demand |
Mature stable operation |
Capacity premium included |
Also test downside combinations. Low volume and slow ramp can occur together. If the project only pays back under the upside case, it is an operational bet rather than a robust investment.
Which KPIs Should Be Tracked after Launch?
Post-launch KPIs should compare actual results with the assumptions that approved the project. Recommended measures include good units per scheduled hour, full cycle time, arc-on time, OEE components, first-pass yield, repair minutes per unit, consumable use, changeover time, and maintenance hours.
Create an owner and review frequency for each measure. A cell can meet its robot cycle target yet miss the business case because loading, minor stops, or downstream rework were underestimated.
JiangSu Dade Heavy Industry develops robotic welding workstations and related handling automation. During concept review, customers should share part families, annual volumes, shift patterns, current cycle studies, defect data, weld procedures, and labor content so the automation scope and financial model use the same assumptions.
Frequently Asked Questions
What is a good payback period for a welding robot?
There is no universal threshold. It depends on capital cost, demand certainty, financing, strategic value, risk, and the company’s investment policy. Compare projects using the same financial rules.
Should safety improvement be converted into cash?
Only where a defensible method exists. Safety can remain a mandatory or strategic benefit without assigning speculative savings from injuries that may not occur.
Does faster welding always improve ROI?
No. If loading, cooling, positioner movement, or inspection is the bottleneck, faster arc travel may create little additional output. Improve the constraint that controls good-part throughput.
How should mixed products be modeled?
Use a weighted product mix with separate cycle, changeover, fixture, and quality assumptions. A single average can hide a product that breaks takt or needs extensive manual work.
When should ROI be recalculated?
Recalculate after concept freeze, supplier quotation, acceptance trials, and several months of stable production. Each stage replaces assumptions with measured data.
Conclusion
A
robotic welding business case is credible when engineering and finance use the same definition of a good part, a full cycle, and a realized benefit. Model takt, OEE, labor, quality, maintenance, ramp-up, and risk explicitly. The strongest project is not the one with the fastest advertised payback; it is the one that continues to create value under realistic operating conditions.